Carbapenemase-Producing Gram Negative Bacilli (CPGNB) Infections - surveillance 2015-2016

From April 1, 2015, to March 31, 2016, 73 healthcare facilities took part in the surveillance of carbapenemase-producing Gram negative bacilli (CPGNB) infections, for a total of 3,749,277 patient days (Table 1). In total, four CPGNB infections were reported among patients who acquired their strain during a current or previous hospital stay in the reporting facility (categories 1a and 1b). The incidence rate of healthcare-associated CPGNB infection (cat. 1a and 1b) was 0.011 per 10,000 patient days. The acquisition rate of healthcare-associated CPGNB colonization (cat. 1a and 1b) was 0.197 per 10,000 patient days. Two teaching facilities and three non-teaching facilities participating last year did not participate this year whereas one teaching and nine non-teaching facilities were added. Data was extracted on May 31st, 2016.
Updated : March 1, 2017
Version française
Table 1 – Participation of Healthcare Facilities in the Surveillance of CPGNB Infections. Québec. 2015-2016
2014-2015 | 2015-2016 | |
|---|---|---|
| Participating facilities (N) | 68 | 73 |
| Admissions (N) | 453,616 | 519,688 |
| Inpatient days (N) | 3,421,806 | 3,749,277 |
| Cases of healthcare-associated CPGNB infection (cat. 1a and 1b) (N) | 9 | 4 |
| Cases of healthcare-associated CPGNB colonization (cat. 1a and 1b) (N) | 58 | 74 |
| Infected patients (cat. 1a + 1b) (N) | 8 | 4 |
Incidence rate
In 2015–2016, the incidence rate of healthcare-associated CPGNB infection (cat. 1a and 1b) was 0.011 per 10,000 patient days in all participating healthcare facilities (Table 2).
All reported infections occurred in teaching healthcare facilities (Table 2).
Table 2 – Incidence Rate and Percentile Distribution of Healthcare-Associated CPGNB Infection (Cat. 1a and 1b) by Type of Healthcare Facility, Québec, 2015–2016 (Incidence Rate per 10,000 Patient Days [95% CI])
| Type of Facility | Min. | 25 % | 50 % | 75 % | 90 % | Max. | Taux d’incidence |
|---|---|---|---|---|---|---|---|
| Non-teaching (N = 51) | 0 | 0 | 0 | 0 | 0 | 0 | 0 |
| Teaching (N = 22) | 0 | 0 | 0 | 0 | 0.097 | 0.233 | 0.020 [0.005 ; 0.045]¥ |
| Total (N = 73) | 0 | 0 | 0 | 0 | 0 | 0.233 | 0.011 [0.003 ; 0.024] |
[I.C. 95%]: 95% confidence interval.
¥ Significant statistical difference (p < 0.05) between incidence rate in non-teaching and teaching healthcare facilities.
Among the 63 healthcare facilities participating in the two years of surveillance, the incidence rate of healthcare-associated CPGNB infections in 2015-2016 was 0.012 per 10,000 patient days and it was half the incidence rate observed in 2014-2015 (Table 3)
Table 3 – Change in Incidence Rate of Healthcare-Associated CPGNB infection (Cat1. 1a and 1b) by Type of Healthcare Facility, Québec, 2014-2015 to 2015–2016 (Incidence Rate per 10,000 Patient Days [95% CI])
2014-2015 | 2015-2016 | |||
|---|---|---|---|---|
Number of Infections | Incidence Rate | Number of Infections | Incidence Rate | |
| Facilities | ||||
| Non-teaching (N = 42) | 1 | 0.007 [0 ; 0.027] | 0 | 0 |
| Teaching (N = 21) | 8 | 0.042 [0.018 ; 0.076] | 4 | 0.020 [0.005 ; 0.045] |
| Total (N = 63) * | 9 | 0.027 [0.012 ; 0.047] | 4 | 0.012 [0.003 ; 0.026] |
* Number of facilities participating in each of the two years of surveillance.
Description of cases
In total, 98 colonizations (including 6 infections) of CPGNB were reported: 81 (82.6%) were identified in patients who acquired their CPGNB colonization during a current hospital stay (3 infections and 68 colonizations), during a previous hospital stay (1 infection and 2 colonizations) or in ambulatory care of the reporting facility (7 colonizations) (cat. 1a, 1b and 1c). One infection have been observed in a patient from the psychiatry unit. A total of 7 colonizations were associated to another facility (1 infection and 6 colonizations), to the community (7 colonizations) or remained unknown (2 colonizations) (cat. 2, 3 and 4) (Table 4).
Table 4 – Cases of CPGNB Infections and Colonizations by Presumed Origin of Acquisition, Québec, 2015–2016
(N, %)
Category | Origin of Acquisition | Infection | Colonization |
|---|---|---|---|
1a | Healthcare-associated with a current hospital stay in the reporting facility | 3 (50.0%) | 71 (72.4%) |
1b | Healthcare-associated with a previous hospital stay in the reporting facility | 1 (16.7%) | 3 (3.1%) |
1c | Healthcare-associated with ambulatory care in the reporting facility | 0 (0%) | 7 (7.1%) |
1d | Healthcare-associated with long-term unit in the reporting facility | 0 (0%) | 0 (0%) |
1e | Healthcare-associated with psychiatry unit in the reporting facility | 1 (16.7%) | 1 (1.0%) |
2 | Healthcare-associated with another facility | 1 (16.7%) | 7 (7.1%) |
3 | Community-associated | 0 (0%) | 7 (7.1%) |
4 | Unknown origin | 0 (0%) | 2 (2.0%) |
| Total | 6 | 98 |
Note: Colonizations included infections.
In 2015-2016, among 6 infections, no primary bloodstream infection (BSI) was observed (Table 5).
Table 5 – Number of Cases of CPGNB Infections from All Origins by Type of Infection and Number of all Origin CPGNB Secondary BSIs , Québec, 2015–2016 (N = 6)
| Type of Infection | Infections (N) | Secondary Bloodstream Infections (N) |
|---|---|---|
| Primary BSI | ||
| CRBSI-MBI | 0 | - |
| CRBSI | 0 | - |
| Non-CRBSI-MBI | 0 | - |
| Non-CRBSI | 0 | - |
| HD | 0 | - |
| Others | ||
| Urinary tract | 2 | 0 |
| Abdominal | 0 | 0 |
| Pulmonary | 2 | 0 |
| Surgical site | 1 | 0 |
| Skin and soft tissue | 0 | 0 |
| Bones and joints | 1 | 0 |
| Others | 0 | 0 |
| Total | 6 | 0 |
BSI: bloodstream infection.
CRBSI: catheter-related bloodstream infection.
MBI: mucosal barrier injury.
Non-CRBSI: non-catheter-related primary bloodstream infection.
HD: hemodialysis.
No deaths within 30 days were observed following onset of infection (Table 6).
Table 6– Number of Deaths and 30-days all Cause Case-fatality in Patients Infected by a CPGNB, Québec, 2015-2016
2014-2015 | 2015-2016 | ||
|---|---|---|---|
| CPGNB infections (all origins) | 13 | 6 | |
| Number of deaths | 5 | 0 | |
| Case fatality | 38.5% | 0% | |
Table 7 – Risk Factors Associated With CPGNB Colonization, Québec, 2014-2015
| Risk Factors | New Carrier | New Carrier | Known Carrier | Information not available on the carrier’s status |
|---|---|---|---|---|
| N | 68 | 12 | 3 | 15 |
| Contact with known carrier | 0 | 12 | 0 | 4 |
| Healthcare abroad (with or without hospitalization) | 3 | 0 | 0 | 0 |
| Travel abroad in the last 12 months | 8 | 0 | 0 | 0 |
| Other risks | ||||
| Carba-3GC*-Fluo | 6 | 4 | 0 | 1 |
| No Carba-3GC-Fluo | 6 | 2 | 0 | 0 |
| Diabetes | 15 | 2 | 0 | 3 |
| Acute renal failure | 3 | 0 | 0 | 0 |
| Chronic renal failure | 5 | 0 | 0 | 1 |
| Non hematologic active neoplasia | 12 | 1 | 1 | 2 |
| Solid organ transplant | 2 | 1 | 0 | 0 |
* 3GC: 3rd generation cephalosporin.
Carba-3GC-Fluo: Taking a carbapenem/3rd generation cephalosporin/fluoroquinolone in the last two weeks prior to diagnosis.
No Carba-3GC-Fluo: not taking a carbapenem/3rd generation cephalosporin/fluoroquinolone in the last two weeks prior to diagnosis.
Colonization Screening Protocol
In 2015-2016, the acquisition rate of healthcare-associated CPGNB colonization (cat. 1a and 1b) was 0.215 per 10,000 patient days among healthcare facilities participating in the two years of surveillance (Table 8) and was 0.197 per 10,000 patient days among all facilities in 2015-2016 (Table 14).
Table 8 – Change in the Number of Cases and Acquisition Rate of Healthcare-associated CPGNB Colonization (Cat. 1a and 1b) by Type of Healthcare Facility, Québec, 2014-2015 to 2015-2016 (Acquisition Rate of Healthcare-Associated CPGNB Colonization per 10,000 patient days)
| Type of Facility | 2014-2015 | 2015-2016 | ||
|---|---|---|---|---|
Number of Colonizations | Acquisition Rate of HA-CPGNB Colonization | Number of Colonizations | Acquisition Rate of HA-CPGNB Colonization | |
| Non-teaching (N = 42) | 33 | 0.228 [0.157 ; 0.312] | 50 | 0.343 [0.254 ; 0.445] |
| Teaching (N = 21) | 25 | 0.130 [0.084 ; 0.186] | 24 | 0.121 [0.077 ; 0.174] |
| Total (N = 63) * | 58 | 0.172 [0.131 ; 0.219] | 74 | 0.215 [0.169 ; 0.267] |
* Number of facilities participating in each of the two years of surveillance.
Table 9 shows the number of non-teaching facilities that indicated the type of screening used at admission (non-teaching: 34 out of 51; teaching: 14 out of 22) and during hospitalization (non-teaching: 27 out of 51; teaching: 16 out of 22).
Table 9 – Number of Healthcare Facilities that Indicated the Type of Screening Procedure Used at Admission and During Hospitalization by Type of Facility, Québec, 2015-2016
Number of Facilities That Indicated the Number of Screening Procedure Used* | ||||
|---|---|---|---|---|
At Admission | During Hospitalization | Not Indicated | Total | |
| Non-teaching (N = 51) | 34 | 27 | 9 | 37 |
| Teaching (N = 22) | 14 | 16 | 4 | 18 |
| Total (N = 73) | 48 | 43 | 13 | 55 |
* The "at admission" and "during hospitalization" categories are not mutually exclusives
Tables 10 and 11 feature the total number of screening tests performed at admission and during hospitalization, as well as the mean number of CPGNB screening tests per admission.
Table 10 – Total Number of Screening Tests Performed at Admission and During Hospitalization by Type of Healthcare Facility, Québec, 2015-2016
| Type of Facility | Total Number of Screening Procedures | |||
|---|---|---|---|---|
At Admission | During Hospitalization | Not Indicated | Total | |
| Non-teaching | 9,602 | 17,048 | 304 | 26,954 |
| Teaching | 14,814 | 20,916 | 1,618 | 37,348 |
| Total | 24,416 | 37,964 | 1,922 | 64,302 |
Table 11 – Mean Number of CPGNB Screening Tests by Type of Healthcare Facility, Québec, 2014-2015 (Mean CPGNB Screening Tests per Admission), Québec, 2015-2016
| Type of Facility | Mean Number of CPGNB Screening Tests* | ||
|---|---|---|---|
At Admission | During Hospitalization | Total | |
| Non-teaching | 0.038 | 0.068 | 0.108 |
| Teaching | 0.055 | 0.077 | 0.138 |
| Total | 0.047 | 0.073 | 0.124 |
* The "at admission" and "during hospitalization" categories are not mutually exclusives.
Microbiology
Figure 1 features the distribution of microorganisms isolated from all cases. A total of 111 microorganisms have been isolated from 98 colonizations. Identified microorganisms were Citrobacter freundii (44.1%), Klebsiella pneumonia (17.1%), Enterobacter cloacae (16.2%) or Escherichia coli (10.8%). For seven colonization cases, two microorganisms have been isolated, whereas for one colonization, a total of four distinct microorganisms have been isolated.
Figure 1 – Categories of Isolated Microorganisms for all Cases (n = 67), Québec, 2015-2016
Isolated Microorganisms - All Cases (n = 111)
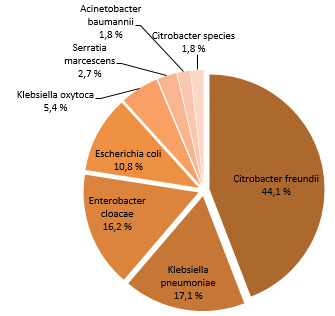
Table 12 presents the proportion of tested strains for sensitivity or resistance to carbapeneme (doripenem, ertapenem, imipenem and meropenem) as well as percentage of resistance among isolated strains.
All the Enterobacter cloacae, Citrobacter freundii, Klebsiella oxytoca, Klebsiella pneumoniae and Serratia marcescens were ertapenem resistant.
Table 12 – Resistance Profile Towards Carbapenem of CPGNB Microorganisms Isolated, Québec, 2015-2016
| Microorganism | Isolated | Tested | Resistants | |||
|---|---|---|---|---|---|---|
N | Antibiotique | N | % | N | % | |
| Acinetobacter baumannii | 2 | Imipénem | 1 | 50.0% | 1 | 100.0% |
| Méropénem | 1 | 50.0% | 1 | 100.0% | ||
| Citrobacter freundii | 49 | Doripénèm | 1 | 2.0% | 1 | 100.0% |
| Ertapénem | 46 | 93.9% | 46 | 100.0% | ||
| Imipénem | 3 | 6.1% | 2 | 66.7% | ||
| Méropénem | 49 | 100.0% | 48 | 98.0% | ||
| Enterobacter cloacae | 18 | Ertapénem | 17 | 94.4% | 17 | 100.0% |
| Imipénem | 7 | 38.9% | 7 | 100.0% | ||
| Méropénem | 17 | 94.4% | 17 | 100.0% | ||
| Escherichia coli | 12 | Ertapénem | 11 | 91.7% | 10 | 90.9% |
| Imipénem | 9 | 75.0% | 9 | 100.0% | ||
| Méropénem | 12 | 100.0% | 12 | 100.0% | ||
| Klebsiella oxytoca | 6 | Ertapénem | 5 | 83.3% | 5 | 100.0% |
| Imipénem | 4 | 66.7% | 4 | 100.0% | ||
| Méropénem | 4 | 66.7% | 4 | 100.0% | ||
| Klebsiella pneumoniae | 19 | Ertapénem | 19 | 100.0% | 19 | 100.0% |
| Imipénem | 12 | 63.2% | 12 | 100.0% | ||
| Méropénem | 19 | 100.0% | 19 | 100.0% | ||
| Serratia marcescens | 3 | Ertapénem | 2 | 66.7% | 2 | 100.0% |
| Imipénem | 1 | 33.3% | 1 | 100.0% | ||
| Méropénem | 2 | 66.7% | 2 | 100.0% | ||
| Citrobacter species | 2 | Ertapénem | 2 | 100.0% | 2 | 100.0% |
| Méropénem | 2 | 100.0% | 2 | 100.0% | |
Note: Only microorganisms that have been tested for an antibiotic are represented.
Table 13 shows the carbapenemase gene detected for every isolated microorganisms. The majority of carbapenemase gene associated to different microorganism is KPC. One strain of Enterobacter cloacae, six strains of Escherichia coli and two strain of Klebsiella pneumoniae produced NDM. One Klebsiella pneumonia strain produced both OXA-48 and NDM.
Table 13 – Distribution of Carbapenemase-encoding Genes from Reported Microorganisms, Québec, 2015-2016
| Microorganism | Isolated | Gene | Gene frequencye | |
|---|---|---|---|---|
N | % | |||
| Acinetobacter baumannii | 2 | OXA-23 | 1 | 50.0 |
| Citrobacter freundii | 49 | KPC | 47 | 95.9 |
| OXA-48 | 2 | 4.1 | ||
| Citrobacter species | 2 | KPC | 2 | 100.0 |
| Enterobacter cloacae | 18 | KPC | 15 | 83.3 |
| NDM | 1 | 5.6 | ||
| NMC | 1 | 5.6 | ||
| Escherichia coli | 12 | KPC | 6 | 50.0 |
| NDM | 6 | 50.0 | ||
| Klebsiella oxytoca | 6 | KPC | 5 | 83.3 |
| Klebsiella pneumoniae | 19 | KPC | 14 | 73.7 |
| OXA-48 | 2 | 10.5 | ||
| NDM | 2 | 10.5 | ||
| NDM / OXA-48 | 1 | 5.3 | ||
| Serratia marcescens | 3 | KPC | 1 | 33.3 |
| SME | 1 | 33.3 | |
KPC : Klebsiella pneumoniae carbapenemase (Class A).
NDM : New-dehli metallo-b-lactamase (Class B).
NMC : Not metalloenzyme carbapenemase.
OXA-23 : Oxacillinase-23 (class D).
OXA-48 : Oxacillinase-48 (Class D).
SME : Serratia marcescens enzyme.
Data per Facility
The incidence rate of healthcare-associated CPGNB infection and the percentile rankings by type of facility are shown in figure 2 and 3. Figure 4 and 5 present the rate of acquisition of healthcare-associated CPGNB colonization by type of facility.
Figure 2 – Incidence Rate and Percentile Ranking of Healthcare-Associated CPGNB infection (Cat. 1a and 1b) for Non-Teaching Healthcare Facilities, Québec, 2015-2016 (Incidence Rate per 10,000 Patient Days)
NB: Non-teaching facilities reported no cases of infection in 2015-2016.
Figure 3 – Incidence Rate and Percentile Ranking of Healthcare-Associated CPGNB Infection (Cat. 1a and 1b) for Teaching Healthcare Facilities, Québec, 2015-2016 (Incidence Rate per 10,000 Patient Days)
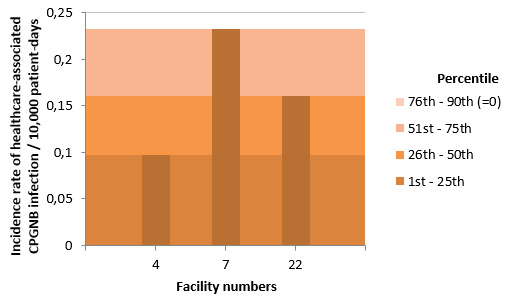
NB: Facilities 2, 3, 5, 8, 12, 13, 15, 18, 20, 21, 24, 27, 28, 29, 30, 31, 33, 76 and 118 did not report any cases of infection in 2015-2016.
Figure 4 – Acquisition Rate of Healthcare-Associated CPGNB Colonization (Cat.1a and 1b) for Non-Teaching Healthcare Facilities, Québec, 2015-2016 (Acquisition Rate of Healthcare-Associated CPGNB Colonization per 10,000 Patient Days)
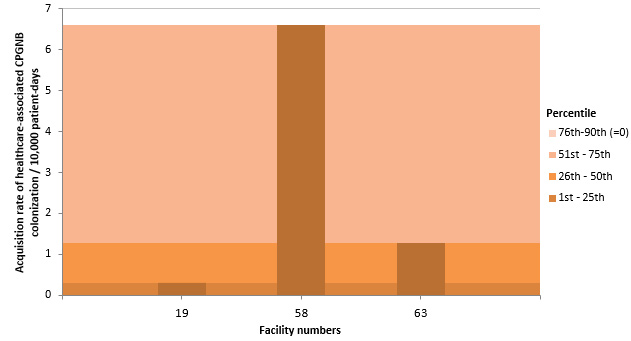
NB: Facilities 9, 11, 16, 23, 26, 32, 34, 35, 37, 39, 40, 42, 44, 45, 46, 47, 49, 51, 52, 53, 56, 59, 61, 65, 67, 70, 71, 74, 75, 77, 81, 82, 84, 85, 86, 88, 89, 91, 97, 99, 100, 101, 103, 107, 109, 112, 113 and 130 did not report any cases of colonization in 2015-2016.
Figure 5 – Acquisition Rate of Healthcare-Associated CPGNB Colonization (Cat.1a and 1b) for Teaching Healthcare Facilities, Québec, 2015-2016 (Acquisition Rate of Healthcare-Associated CPGNB Colonization per 10,000 Patient Days)
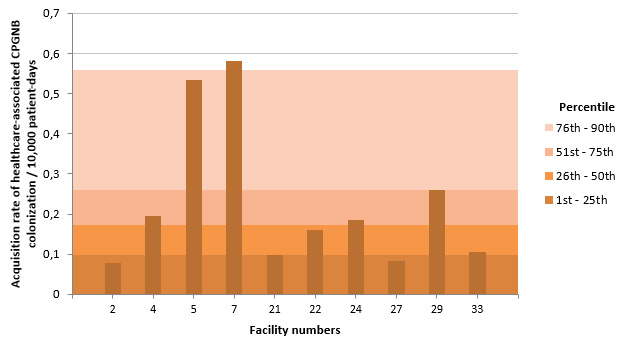
NB: Facilities 3, 8, 12, 13, 15, 18, 20, 28, 30, 31, 76 and 118 did not report any cases of colonization in 2015-2016.
At the local level, in 2015-2016, the incidence rate of healthcare-associated CPGNB infections ranged from 0 to 0.233 per 10,000 patient days, whereas the acquisition rate of healthcare-associated CPGNB colonization ranged from 0 to 6,603 per 10,000 patient days. A total of 60 facilities (82%) did not report any healthcare-associated CPGNB infection or colonization in 2015-2016. A detailed summary of the surveillance data for HA-CPGNB infection by healthcare facility can be found in table 14.
Table 14 – Incidence Rate of Healthcare-Associated CPGNB Infection (cat. 1a and 1b), Acquisition Rate of Healthcare-Associated CPGNB Colonization and Mean CPGNB Screening Tests by Admission and by Facility, Québec, 2015-2016 (Incidence Rate per 10,000 Patient Days [95% CI]; Acquisition Rate of Colonization per 10,000 Patient Days)
HR | Facility | Incidence Rate of HA-CPGNB Infection (cat. 1a and 1b) [95% CI] | Acquisition Rate of HA-CPGNB Colonization (cat. 1a and 1b) [95% CI] | Mean CPGNB Screening Tests per Admission* | |
|---|---|---|---|---|---|
Number | Name | ||||
1 | 16 | HÔPITAL RÉGIONAL DE RIMOUSKI | 0 | 0 | 0.083 |
32 | CENTRE HOSPITALIER RÉGIONAL DU GRAND-PORTAGE | 0 | 0 | 0.056 | |
61 | HÔPITAL NOTRE-DAME-DE-FATIMA | 0 | 0 | 0.079 | |
71 | HÔPITAL DE MATANE | 0 | 0 | 0.035 | |
77 | HÔPITAL D'AMQUI | 0 | 0 | 0 | |
84 | HÔPITAL DE NOTRE-DAME-DU-LAC | 0 | 0 | 0.037 | |
|
| BAS-SAINT-LAURENT | 0 | 0 | 0.061 |
2 | 20 | HÔPITAL DE CHICOUTIMI | 0 | 0 | 0.001 |
67 | HÔPITAL ET CENTRE DE RÉADAPTATION DE JONQUIÈRE | 0 | 0 | 0.013 | |
74 | HÔPITAL DE DOLBEAU-MISTASSINI | 0 | 0 | 0.005 | |
88 | HÔPITAL. CLSC ET CENTRE D'HÉBERGEMENT DE ROBERVAL | 0 | 0 | 0 | |
100 | HÔPITAL DE LA BAIE | 0 | 0 | 0 | |
112 | HÔPITAL D'ALMA | 0 | 0 | 0 | |
|
| SAGUENAY–LAC-SAINT-JEAN | 0 | 0 | 0.002 |
3 | 2 | HÔPITAL DE L'ENFANT-JÉSUS | 0 | 0.078 | 0.077 |
7 | PAVILLON L'HÔTEL-DIEU DE QUÉBEC | 0.233 [0.022 ; 0.668] | 0.582 | 0.103 | |
24 | HÔPITAL DU SAINT-SACREMENT | 0 | 0.184 | 0.026 | |
27 | PAVILLON CENTRE HOSPITALIER DE L'UNIVERSITÉ LAVAL | 0 | 0.084 | 0.017 | |
28 | PAVILLON SAINT-FRANCOIS D'ASSISE | 0 | 0 | 0.023 | |
33 | INSTITUT UNIVERSITAIRE DE CARDIOLOGIE ET DE PNEUMOLOGIE DE QUÉBEC | 0 | 0.105 | 0.112 | |
59 | HÔPITAL DE BAIE-SAINT-PAUL | 0 | 0 | 0.014 | |
86 | HÔPITAL DE LA MALBAIE | 0 | 0 | 0.009 | |
|
| CAPITALE-NATIONALE | 0.034 [0.003 ; 0.097] | 0.153 | 0.057 |
4 | 23 | HÔTEL-DIEU D'ARTHABASKA | 0 | 0 | 0.008 |
31 | PAVILLON SAINTE-MARIE | 0 | 0 | 0.002 | |
41 | HÔPITAL DU CENTRE-DE-LA-MAURICIE | - | - | - | |
44 | HÔPITAL SAINTE-CROIX | 0 | 0 | 0.034 | |
85 | CENTRE DE SANTÉ ET DE SERVICES SOCIAUX DU HAUT-SAINT-MAURICE | 0 | 0 | 0 | |
|
| MAURICIE ET CENTRE-DU-QUÉBEC | 0 | 0 | 0.011 |
5 | 15 | HÔPITAL FLEURIMONT | 0 | 0 | 0 |
30 | HOTEL-DIEU DE SHERBROOKE | 0 | 0 | 0 | |
46 | HÔPITAL DE GRANBY | 0 | 0 | 0 | |
49 | CENTRE DE SANTÉ ET DE SERVICES SOCIAUX MEMPHRÉMAGOG | 0 | 0 | 0 | |
75 | CENTRE DE SANTÉ ET DE SERVICES SOCIAUX DU GRANIT | 0 | 0 | 0 | |
99 | HÔPITAL BROME-MISSISQUOI-PERKINS | 0 | 0 | 0.001 | |
| ESTRIE | 0 | 0 | 0 | |
6 | 3 | GLEN - ROYAL VICTORIA | 0 | 0 | 0.052 |
4 | HÔPITAL NOTRE-DAME DU CHUM | 0.097 [0 ; 0.381] | 0.195 | 0.046 | |
5 | HÔPITAL GÉNÉRAL JUIF | 0 | 0.535 | 1.375 | |
6 | GLEN - ENFANTS | - | - | - | |
8 | PAVILLON MAISONNEUVE/PAVILLON MARCEL-LAMOUREUX | 0 | 0 | 0.001 | |
12 | CENTRE HOSPITALIER UNIVERSITAIRE SAINTE-JUSTINE | 0 | 0 | 0 | |
13 | INSTITUT DE CARDIOLOGIE DE MONTRÉAL | 0 | 0 | 0.064 | |
21 | HÔPITAL SAINT-LUC DU CHUM | 0 | 0.099 | 0.063 | |
22 | HÔTEL-DIEU DU CHUM | 0.161 [0 ; 0.630] | 0.161 | 0.076 | |
25 | HÔPITAL DU SACRÉ-COEUR DE MONTRÉAL | - | - | - | |
26 | HÔPITAL DE VERDUN | 0 | 0 | 0.005 | |
29 | HÔPITAL GÉNÉRAL DE MONTRÉAL | 0 | 0.259 | 0.218 | |
34 | HÔPITAL SANTA CABRINI | 0 | 0 | 0 | |
36 | HÔPITAL GÉNÉRAL DU LAKESHORE | - | - | - | |
38 | HÔPITAL JEAN-TALON | - | - | - | |
48 | CENTRE HOSPITALIER DE ST. MARY | - | - | - | |
76 | HOPITAL DE LACHINE | 0 | 0 | 0 | |
80 | HÔPITAL FLEURY | - | - | - | |
83 | HÔPITAL DE LASALLE | - | - | - | |
118 | HÔPITAL NEUROLOGIQUE DE MONTRÉAL | 0 | 0 | 0.027 | |
| MONTRÉAL | 0.019 [0.002 ; 0.054] | 0.141 | 0.246 | |
7 | 39 | HÔPITAL DE GATINEAU | 0 | 0 | 0.001 |
40 | HÔPITAL DE HULL | 0 | 0 | 0.005 | |
51 | HÔPITAL DE MANIWAKI | 0 | 0 | 0 | |
95 | HÔPITAL DU PONTIAC | - | - | - | |
111 | HÔPITAL DE PAPINEAU | - | - | - | |
| OUTAOUAIS | 0 | 0 | 0.002 | |
8 | 47 | HÔPITAL DE ROUYN-NORANDA | 0 | 0 | 0.003 |
52 | HÔPITAL D'AMOS | 0 | 0 | 0 | |
65 | HÔPITAL ET CLSC DE VAL-D'OR | 0 | 0 | 0.005 | |
70 | CENTRE DE SOINS DE COURTE DURÉE LA SARRE | 0 | 0 | 0 | |
82 | PAVILLON SAINTE-FAMILLE | 0 | 0 | 0.015 | |
|
| ABITIBI-TÉMISCAMINGUE | 0 | 0 | 0.002 |
64 | HÔPITAL LE ROYER | - | - | - | |
9 | 72 | HÔPITAL ET CENTRE D'HÉBERGEMENT DE SEPT-ÎLES | - | - | - |
|
| CÔTE-NORD | - | - | - |
10 | 96 | CENTRE DE SANTÉ DE CHIBOUGAMAU | - | - | - |
|
| NORD-DU-QUÉBEC | - | - | - |
11 | 53 | HÔPITAL DE CHANDLER | 0 | 0 | 0 |
91 | HÔPITAL HÔTEL-DIEU DE GASPÉ | 0 | 0 | 0.229 | |
97 | HÔPITAL DE MARIA | 0 | 0 | 0.114 | |
107 | HÔPITAL DE L'ARCHIPEL | 0 | 0 | 0.039 | |
109 | HÔPITAL DE SAINTE-ANNE-DES-MONTS | 0 | 0 | 0.074 | |
|
| GASPÉSIE–ÎLES-DE-LA-MADELEINE | 0 | 0 | 0.100 |
12 | 18 | HÔTEL-DIEU DE LÉVIS | 0 | 0 | 0.028 |
63 | HÔPITAL DE SAINT-GEORGES | 0 | 1.274 | 0.385 | |
89 | HÔPITAL DE MONTMAGNY | 0 | 0 | 0.014 | |
113 | HÔPITAL DE THETFORD MINES | 0 | 0 | 0.018 | |
| CHAUDIÈRE-APPALACHES | 0 | 0.324 | 0.118 | |
13 | 19 | HÔPITAL CITÉ DE LA SANTÉ | 0 | 0.293 | 0.132 |
|
| LAVAL | 0 | 0.293 | 0.132 |
14 | 11 | HÔPITAL PIERRE-LE GARDEUR | 0 | 0 | 0.017 |
14 | CENTRE HOSPITALIER RÉGIONAL DE LANAUDIÈRE | - | - | - | |
|
| LANAUDIÈRE | 0 | 0 | 0.017 |
15 | 45 | HÔPITAL DE SAINT-EUSTACHE | 0 | 0 | 0.004 |
56 | CENTRE DE SANTÉ ET DE SERVICES SOCIAUX D'ARGENTEUIL | 0 | 0 | 0.050 | |
81 | HÔPITAL DE MONT-LAURIER | 0 | 0 | 0.059 | |
101 | HÔPITAL RÉGIONAL DE SAINT-JÉRÔME | 0 | 0 | 0.003 | |
103 | HÔPITAL LAURENTIEN | 0 | 0 | 0.003 | |
|
| LAURENTIDES | 0 | 0 | 0.008 |
16 | 1 | HÔPITAL CHARLES LEMOYNE | - | - | - |
9 | HÔPITAL DU HAUT-RICHELIEU | 0 | 0 | 0 | |
10 | HÔPITAL PIERRE-BOUCHER | - | - | - | |
35 | HÔPITAL HONORÉ-MERCIER | 0 | 0 | 0.016 | |
37 | HÔTEL-DIEU DE SOREL | 0 | 0 | 0 | |
42 | CENTRE HOSPITALIER ANNA-LABERGE | 0 | 0 | 0.101 | |
58 | HÔPITAL DU SUROÎT | 0 | 6.603 | 2.038 | |
130 | HÔPITAL BARRIE MEMORIAL | 0 | 0 | 1.211 | |
| MONTÉRÉGIE | 0 | 1.167 | 0.385 | |
| Total | 0.011 [0.003 ; 0.024] | 0.197 | 0.124 |
* Number of screening test divided by number of admissions.
- Healthcare facilities that did not participate in 2015-2016.
HR: Health region.
Author
Comité de surveillance provinciale des infections nosocomiales (SPIN)
Editorial committee
Christophe Garenc, Direction des risques biologiques et de la santé au travail, Institut national de santé publique du Québec
Danielle Moisan, Centre hospitalier régional du Grand-Portage
Muleka Ngenda-Muadi, Direction des risques biologiques et de la santé au travail, Institut national de santé publique du Québec
Mélissa Trudeau, Direction des risques biologiques et de la santé au travail, Institut national de santé publique du Québec
Isabelle Rocher, Direction des risques biologiques et de la santé au travail, Institut national de santé publique du Québec
Christian Lavallée, Hôpital Maisonneuve-Rosemont
Jasmin Villeneuve, Direction des risques biologiques et de la santé au travail, Institut national de santé publique du Québec