Central Line–Associated Bloodstream Infections in Intensive Care Units: Surveillance 2015-2016

From April 1st, 2015, to March 31st, 2016, 66 intensive care units (ICUs) took part in surveillance of central line–associated bloodstream infections (CLABSIs), for a combined total of 128,035 catheter-days (Table 1). Participating ICUs reported 150 CLABSIs in 139 patients. Incidence rates are 0.70 per 1,000 catheter-days in teaching adult ICUs, 0.42 in non-teaching adult ICUs, 1.95 in pediatric ICUs and 4.15 in neonatal ICUs (including cases with a mucosal barrier injury). No case is observed in coronary ICUs. Compared to 2014-2015, a coronary ICU and a teaching ICU stopped participating, while a neonatal ICU joined surveillance; one teaching and one non-teaching ICU that participated in 2014-2015 but provided less than 11 periods of data in 2015-2016, are not included in the results. A minimum of 11 periods of data are to be provided for ICUs data to be included in this surveillance report. Data were extracted on May 31st, 2016.
Updated : March 3, 2017
Version française
Table 1 – Participation of ICUs in the Surveillance of CLABSIs, Québec, 2011–2012 to 2015–2016
2011 - 2012 | 2012 - 2013 | 2013 - 2014 | 2014 - 2015 | 2015 - 2016 | |
|---|---|---|---|---|---|
| Participating ICUs (N) | 62 | 63 | 65 | 67 | 66 |
| Patient-days (N) | 285,130 | 290,380 | 300,101 | 305,592 | 297,430 |
| Catheter-days (N) | 127,138 | 127,105 | 129,838 | 131,473 | 128,035 |
| CLABSIs (cat. 1a and 1b, N) | 194 | 189 | 166 | 121 | 150 |
| Infected patients (N) | 184 | 185 | 154 | 119 | 139 |
Incidence rates
In 2015–2016, incidence rates are 0.70 per 1,000 catheter-days in teaching adult ICUs, 0.42 in non-teaching adult ICUs, 1.95 in pediatric ICUs and 4.15 in neonatal ICUs. No case is observed in coronary ICUs. Among other types of ICUs, the lowest rate is for adult non-teaching ICUs (Table 2). The CLABSI incidence rate is highest in neonatal and pediatric ICUs. Two cases of mucosal barrier injuries are observed: one in an adult teaching ICU and another in a neonatal ICU.
Table 2 – CLABSI Incidence Rate and Catheter Utilization Ratio, by Type of Healthcare Facility and Type of ICU, Québec, 2015–2016 (Incidence Rate per 1,000 Catheter-days [95% CI])
| Type of ICU | ICUs (N) | Incidence Rate (excluding mucosal barrier injuries) | Incidence Rate (including mucosal barrier injuries) | Utilization Ratio |
|---|---|---|---|---|
| Coronary | 2 | 0 | 0 | 0.27 |
| Adult. teaching | 26 | 0.69 [0.52 ; 0.89] | 0.70 [0.52 ; 0.90] | 0.63 |
| Adult. non-teaching | 27 | 0.42 [0.21 ; 0.71] | 0.42 [0.21 ; 0.71] | 0.31 |
| Pediatric | 4 | 1.95 [1.11 ; 3.02] | 1.95 [1.11 ; 3.02] | 0.68 |
| Neonatal | 7 | 4.09 [3.18 ; 5.11] | 4.15 [3.24 ; 5.18] | 0.22 |
95% CI: 95% confidence interval.
In 2015–2016, incidence rates tend to be higher among small birth weight babies (Table 3).
Table 3 –CLABSI Incidence Rate in Neonatal ICUs, by Birth Weight Category, Québec, 2015–2016 (Incidence Rate per 1,000 Catheter-days [95% CI])
| Birth Weight Category (grams) | Number of Cases | Incidence Rate |
|---|---|---|
≤750 | 26 | 8.56 [5.59 ; 12.17] |
751-1,000 | 19 | 5.21 [3.13 ; 7.82] |
1,001-1,500 | 13 | 3.73 [1.98 ; 6.03] |
1,501-2,500 | 5 | 1.74 [0.55 ; 3.60] |
>2,500 | 7 | 1.82 [0.72 ; 3.42] |
Total | 70 | 4.15 [3.24 ; 5.18] |
Incidence rate trends
2015-2016 incidence rates show a decrease for most ICUs, compared to the four preceding years, except for neonatal ICUs, where they show an increase (Figure 1). In coronary ICUs, this year’s incidence rate is equal to zero.
Figure 1 – CLABSI Incidence Rate, by Type of Healthcare Facility and Type of ICU, in ICUs that previously participated in surveillance, Québec, 2011–2015 and 2015–2016 (Incidence Rate per 1,000 Catheter-days [I.C. 95%])
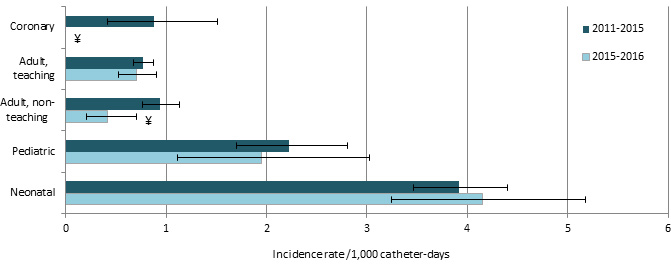
¥ : Significant difference (p ˂ 0,05) between 2011-2015 and 2015-2016.
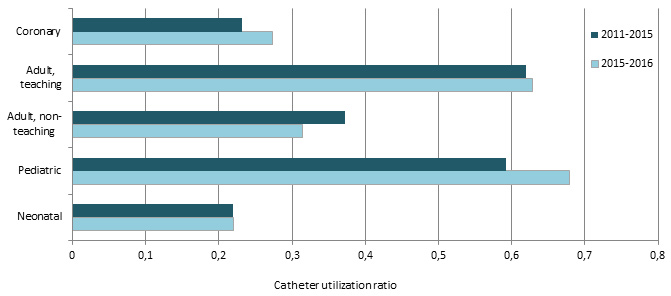
In 2015-2016, compared to 2011-2015, utilization ratios tend to increase, except in adult non teaching ICUs, where it decreases and in neonatal ICUs, where ratios are stable (Figure 2).
Figure 2 – Catheter Utilization Ratio, by Type of Healthcare Facility and Type of ICU, in ICUs that previously participated in surveillance, Québec, 2011–2015 and 2015–2016
Description of cases
The central lines most frequently associated with bloodstream infections are peripherally inserted central catheters (PICCs), followed by 'other' central venous catheters (CVCs) (that include central lines previously named 'regular' CVCs), and umbilical catheters (mostly in neonatal ICUs) (Figure 3).
Figure 3 – Type of Central Line Used in CLABSI Cases, by Type of Healthcare Facility and Type of ICU, Québec, 2015–2016 (N)
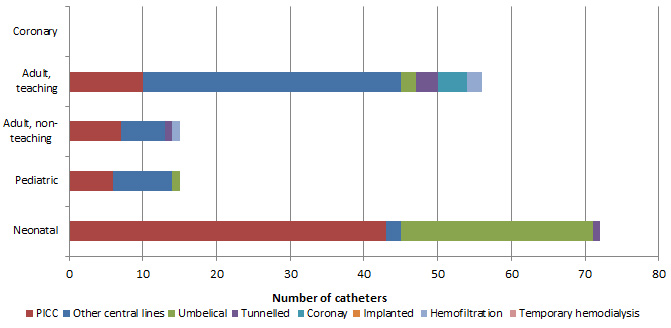
NB: More than one central line may be reported in any given case of CLABSI, which explains why the total number of central lines is higher than the total number of CLABSIs presented earlier in this paper.
In 2015–2016, 14.0% of CLABSI cases died in the 30 days after bloodstream infection onset (Table 4). Case fatality is 45.5% in adult non teaching ICUs (Table 4) but the number of cases was very small (5 deaths on a total of 11 bloodstream infections). Also, all deaths that occurred in adult non teaching ICUs did so within 10 days of bloodstream infection onset. The overall case fatality of 14.0% is lower than the 2014-2015 19.0% case fatality.
Figure 4 – 30-Day Case Fatality, by Type of Healthcare Facility and Type of ICU, Québec, 2015–2016 (%)
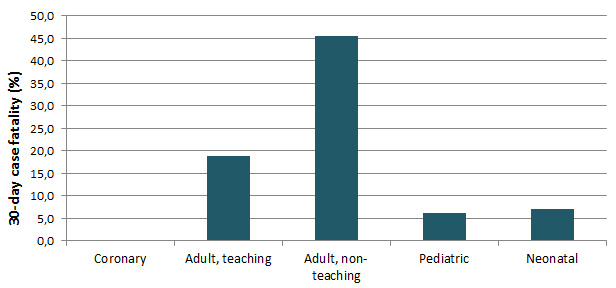
Table 4 – 30-Day Case Fatality, by Type of Healthcare Facility and Type of ICU, Québec, 2015–2016 (N, %)
| Type of ICU | CLABSIs (N) | Death in 10 Days | Death in 30 Days | ||
|---|---|---|---|---|---|
N | % | N | % | ||
| Coronary | 0 | 0 | - | 0 | - |
| Adult, teaching | 53 | 3 | 5.7 | 10 | 18.9 |
| Adult, non-teaching | 11 | 5 | 45.5 | 5 | 45.5 |
| Pediatric | 16 | 0 | 0 | 1 | 6.3 |
| Neonatal | 70 | 3 | 4.3 | 5 | 7.1 |
| Total | 150 | 11 | 7.3 | 21 | 14.0 |
Microbiology
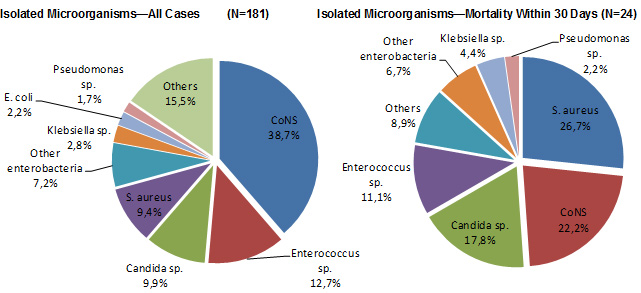
Figure 5 shows that the microorganisms most frequently isolated in reported CLABSI cases are coagulase-negative staphylococci (CoNS, 39%), followed by Enterococcus sp. (13%), Candida sp. (10%) and S. aureus (9 %). CoNS and S.aureus are present in half of cases resulting in death (49%).
Figure 5 – Categories of Isolated Microorganisms in All Cases and Cases of Mortality Within 30 Days, Québec, 2015–2016 (%)
In 2015–2016, 17.6% of S. aureus strains are resistant to oxacillin, compared to 11.8% in 2014-2015. No vancomycin-resistant enterococci is reported (Table 5 and Figure 6).
Tableau 5 – Percentage of Strains Tested and Percentage of Resistance to Antibiotics for Certain Isolated Microorganisms, Québec, 2015–2016 (N, %)
| Microorganism | Antibiotic | Isolated | Tested | Resistant | ||
|---|---|---|---|---|---|---|
N | N | % | N | % | ||
| Staphylococcus aureus | Oxacillin | 17 | 17 | 100.0 | 3 | 17.6 |
| Enterococcus | Vancomycin | 21 | 21 | 100.0 | 0 | 0.0 |
| Enterococcus faecalis | Vancomycin | 18 | 18 | 100.0 | 0 | 0.0 |
| Enterococcus faecium | Vancomycin | 3 | 3 | 100.0 | 0 | 0.0 |
| Klebsiella sp. | CSE 4 | 5 | 5 | 100.0 | 0 | 0.0 |
| Imipenem or meropenem | 5 | 4 | 80.0 | 0 | 0.0 | |
| Multiresistant 1 | 5 | 5 | 100.0 | 0 | 0.0 | |
| Escherichia coli | CSE 4 | 4 | 4 | 100.0 | 0 | 0.0 |
| Fluoroquinolones 3 | 4 | 2 | 50.0 | 1 | 50.0 | |
| Imipenem or meropenem | 4 | 4 | 100.0 | 0 | 0.0 | |
| Multiresistant 1 | 4 | 4 | 100.0 | 0 | 0.0 | |
| Enterobacter sp. | CSE 4 | 9 | 9 | 100.0 | 1 | 11.1 |
| Imipenem or meropenem | 9 | 8 | 88.9 | 0 | 0.0 | |
| Multiresistant 1 | 9 | 9 | 100.0 | 0 | 0.0 | |
| Carbapénèmes | 9 | 8 | 88.9 | 0 | 0.0 | |
| Pseudomonas sp. | Amikacin, gentamicin or tobramycin | 3 | 3 | 100.0 | 1 | 33.3 |
| CSE 2 | 3 | 3 | 100.0 | 0 | 0.0 | |
| Fluoroquinolones 2 | 3 | 3 | 100.0 | 1 | 33.3 | |
| Imipenem or meropenem | 3 | 3 | 100.0 | 1 | 33.3 | |
| Piperacillin/tazobactam | 3 | 2 | 66.7 | 1 | 50.0 | |
| Multiresistant 2 | 3 | 3 | 100.0 | 1 | 33.3 | |
| Acinetobacter sp. | Imipenem or meropenem | 1 | 1 | 100.0 | 0 | 0.0 |
| Multiresistant 3 | 1 | 1 | 100.0 | 0 | 0.0 | |
CSE 4 : cefepime, cefotaxime, ceftazidime or ceftriaxone;
CSE 2 : cefepime or ceftazidime;
Fluoroquinolones 2 : ciprofloxacin ou levofloxacin;
Fluoroquinolones 3 : ciprofloxacin, levofloxacin or moxifloxacine;
Multiresistant 1 : intermediate or resistant to an agent in three of the following five categories: cephalosporins 4, fluoroquinolones 3, aminoglycosides, carbapenems, piperacillin or piperacillin/tazobactam;
Multiresistant 2 : intermediate or resistant to an agent in three of the following five categories: cephalosporins 2, fluoroquinolones 2, aminoglycosides, carbapenems, piperacillin or piperacillin/tazobactam;
Multiresistant 3 : intermediate or resistant to an agent in three of the following six categories: cephalosporins 2, fluoroquinolones 2, aminoglycosides, carbapenems, piperacillin or piperacillin/tazobactam, ampicillin/sulbactam.
Figure 6 – Antibiotic Resistance in Gram-Positive Bacteria, Gram-Negative Bacteria and Pseudomonas sp., Québec, 2011–2015 to 2015–2016 (%)
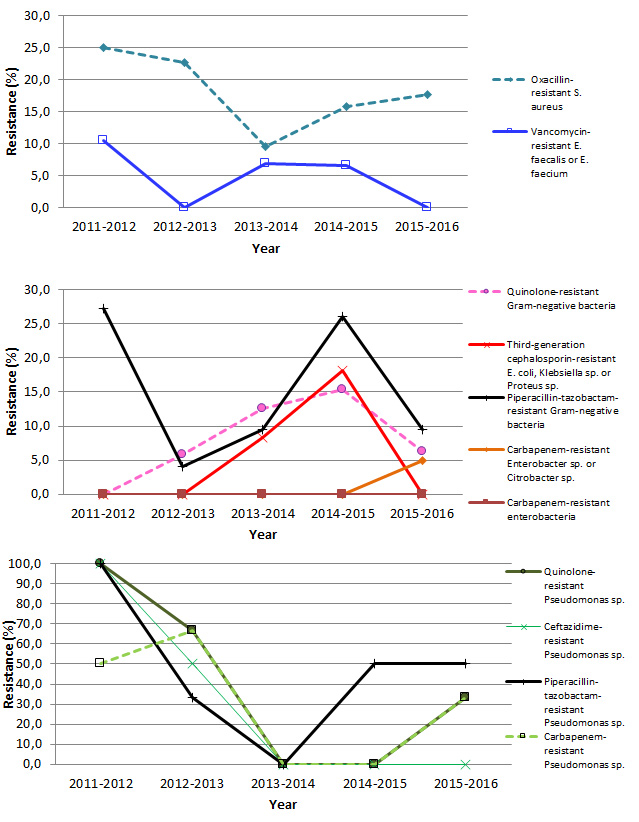
Note: Resistance proportion computations are based on small numbers, leading to a great volatility in results.
Results per ICU
In 2015–2016, one adult teaching ICU and one adult non teaching ICU had a rate above the 90th percentile of their respective categories (Figures 8 and 9). Tables 6 and 7 present the numerical values that correspond to the rates displayed in Figures 7 through 11. Tables 8 and 9 show the catheter utilization rates for each ICU.
Figure 7 – CLABSI Incidence Rate per ICU (2015–2016) and Percentile Ranking (2011–2012 to 2014–2015), Coronary ICUs, Québec, 2015–2016 (Incidence Rate per 1,000 Catheter-days)
Note : Coronary ICUs report no case in 2015-2016.
Figure 8 – CLABSI Incidence Rate per ICU (2015–2016) and Percentile Ranking (2011–2012 to 2014–2015), Teaching Adult ICUs, Québec, 2015–2016 (Incidence Rate per 1,000 Catheter-days)
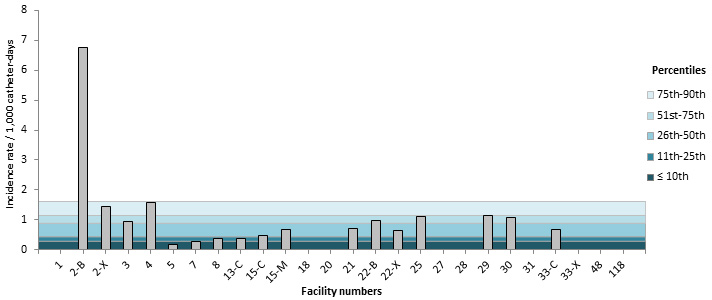
Note: In healthcare facilities with more than one type of ICU: C = surgical, M = medical, X = mixed and B = burn trauma.
Figure 9 – CLABSI Incidence Rate per ICU (2015–2016) and Percentile Ranking (2011–2012 to 2014–2015), Non-Teaching Adult ICUs, Québec, 2015–2016 (Incidence Rate per 1,000 Catheter-days)
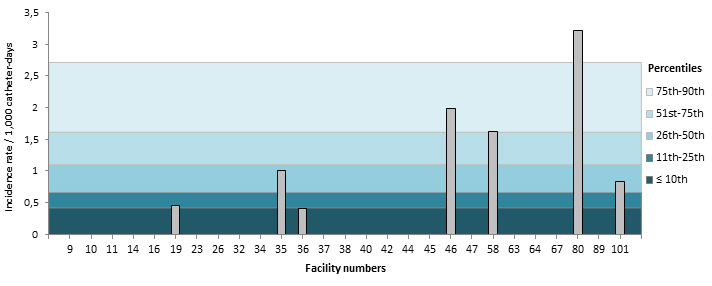
Figure 10 – CLABSI Incidence Rate (2015–2016) and Percentile Ranking (2011–2012 to 2014–2015) per ICU, Pediatric ICUs, Québec, 2015–2016 (Incidence Rate per 1,000 Catheter-days)
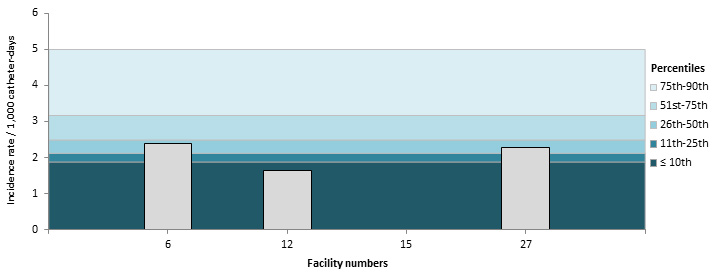
Figure 11 – CLABSI Incidence Rate (2015–2016) and Percentile Ranking (2011–2012 to 2014–2015), per ICU, Neonatal ICUs, Québec, 2015–2016 (Incidence Rate per 1,000 Catheter-days)
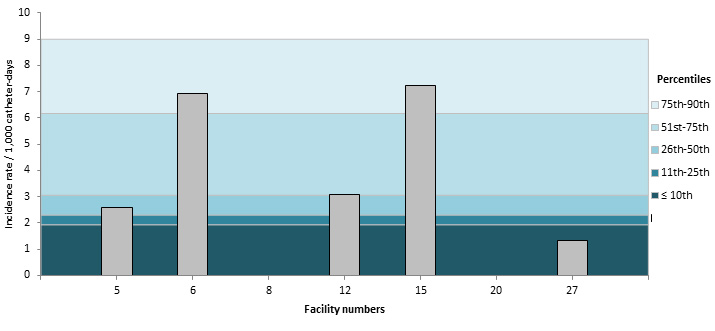
Table 6 – CLABSI Incidence Rate per ICU, Distribution of CLABSI rates for 2011–2015 and the Ministry’s Strategic Planning Threshold, by ICU Types, for Teaching Healthcare Facilities, Québec, 2015–2016 (Incidence Rate per 1,000 Catheter-days)
| Facility | Adult, teaching* | Coronary | Pediatric | Neonatal | |
|---|---|---|---|---|---|
1 | HÔPITAL CHARLES LEMOYNE | 0 | |||
2 | HÔPITAL DE L'ENFANT-JÉSUS | 6.76-B | |||
2 | HÔPITAL DE L'ENFANT-JÉSUS | 1.46-X | |||
3 | GLEN - ROYAL VICTORIA | 0.96 | |||
4 | HÔPITAL NOTRE-DAME DU CHUM | 1.57 | |||
5 | HÔPITAL GÉNÉRAL JUIF | 0.19 | 2.60 | ||
6 | GLEN - ENFANTS | 2.38 | 6.93 | ||
7 | PAVILLON L'HÔTEL-DIEU DE QUÉBEC | 0.29 | |||
8 | PAVILLON MAISONNEUVE/PAVILLON MARCEL-LAMOUREUX | 0.38 | 0 | 0 | |
12 | CENTRE HOSPITALIER UNIVERSITAIRE SAINTE-JUSTINE | 1.65 | 3.09 | ||
13 | INSTITUT DE CARDIOLOGIE DE MONTRÉAL | 0.37 | |||
15 | HÔPITAL FLEURIMONT | 0.47-C | 0 | 7.23 | |
15 | HÔPITAL FLEURIMONT | 0.68-M | |||
18 | HÔTEL-DIEU DE LÉVIS | 0 | |||
20 | HÔPITAL DE CHICOUTIMI | 0 | 0 | ||
21 | HÔPITAL SAINT-LUC DU CHUM | 0.70 | |||
22 | HÔTEL-DIEU DU CHUM | 0.97-B | 0 | ||
22 | HÔTEL-DIEU DU CHUM | 0.66-X | |||
25 | HÔPITAL DU SACRÉ-COEUR DE MONTRÉAL | 1.12 | |||
27 | PAVILLON CENTRE HOSPITALIER DE L'UNIVERSITÉ LAVAL | 0 | 2.27 | 1.33 | |
28 | PAVILLON SAINT-FRANCOIS D'ASSISE | 0 | |||
29 | HÔPITAL GÉNÉRAL DE MONTRÉAL | 1.15 | |||
30 | HOTEL-DIEU DE SHERBROOKE | 1.09 | |||
31 | PAVILLON SAINTE-MARIE | 0 | |||
33 | INSTITUT UNIVERSITAIRE DE CARDIOLOGIE ET DE PNEUMOLOGIE DE QUÉBEC | 0.67-C | |||
33 | INSTITUT UNIVERSITAIRE DE CARDIOLOGIE ET DE PNEUMOLOGIE DE QUÉBEC | 0-X | |||
48 | CENTRE HOSPITALIER DE ST. MARY | 0 | |||
118 | HÔPITAL NEUROLOGIQUE DE MONTRÉAL | 0 |
|
|
|
2011–2015 percentile ranking | 10th | 0.29 | 0.30 | 1.88 | 1.93 |
| 25th | 0.44 | 0.30 | 2.12 | 2.31 | |
| 50th | 0.90 | 0.51 | 2.49 | 3.06 | |
| 75th | 1.15 | 1.69 | 3.17 | 6.17 | |
| 90th | 1.62 | 1.69 | 3.72 | 7.56 | |
Note: In healthcare facilities with more than one type of adult ICU: C = surgical, M = medical, X = mixed and B = burn trauma.
Table 7 – CLABSI Incidence Rate per ICU, Distribution of CLABSI rates for 2011–2015 and the Ministry’s Strategic Planning Threshold, by ICU Types, for Non-teaching Healthcare Facilities, Québec, 2015–2016 (Incidence Rate per 1,000 Catheter-days)
| Facility | Adult, Non-teaching | |
|---|---|---|
9 | HÔPITAL DU HAUT-RICHELIEU | 0 |
10 | HÔPITAL PIERRE-BOUCHER | 0 |
11 | HÔPITAL PIERRE-LE GARDEUR | 0 |
14 | CENTRE HOSPITALIER RÉGIONAL DE LANAUDIÈRE | 0 |
16 | HÔPITAL RÉGIONAL DE RIMOUSKI | 0 |
19 | HÔPITAL CITÉ DE LA SANTÉ | 0.46 |
23 | HÔTEL-DIEU D'ARTHABASKA | 0 |
26 | HÔPITAL DE VERDUN | 0 |
32 | CENTRE HOSPITALIER RÉGIONAL DU GRAND-PORTAGE | 0 |
34 | HÔPITAL SANTA CABRINI | 0 |
35 | HÔPITAL HONORÉ-MERCIER | 1.00 |
36 | HÔPITAL GÉNÉRAL DU LAKESHORE | 0.41 |
37 | HÔTEL-DIEU DE SOREL | 0 |
38 | HÔPITAL JEAN-TALON | 0 |
40 | HÔPITAL DE HULL | 0 |
42 | CENTRE HOSPITALIER ANNA-LABERGE | 0 |
44 | HÔPITAL SAINTE-CROIX | 0 |
45 | HÔPITAL DE SAINT-EUSTACHE | 0 |
46 | HÔPITAL DE GRANBY | 1.98 |
47 | HÔPITAL DE ROUYN-NORANDA | 0 |
58 | HÔPITAL DU SUROÎT | 1.62 |
63 | HÔPITAL DE SAINT-GEORGES | 0 |
64 | HÔPITAL LE ROYER | 0 |
67 | HÔPITAL ET CENTRE DE RÉADAPTATION DE JONQUIÈRE | 0 |
80 | HÔPITAL FLEURY | 3.22 |
89 | HÔPITAL DE MONTMAGNY | 0 |
101 | HÔPITAL RÉGIONAL DE SAINT-JÉRÔME | 0.83 |
2011–2015 percentile ranking | 10th | 0.42 |
| 25th | 0.67 | |
| 50th | 1.10 | |
| 75th | 1.61 | |
| 90th | 2.71 | |
Table 8 – Catheter Utilization Ratio per ICU, Distribution of Ratios for 2011–2015, by ICU Types, for Teaching Healthcare Facilities, Québec, 2015–2016
| Facility | Adult, teaching* | Coronary | Pediatric | Neonatal | |
|---|---|---|---|---|---|
1 | HÔPITAL CHARLES LEMOYNE | 0.44 | |||
2 | HÔPITAL DE L'ENFANT-JÉSUS | 0.20-B | |||
2 | HÔPITAL DE L'ENFANT-JÉSUS | 0.49-X | |||
3 | GLEN - ROYAL VICTORIA | 0.81 | |||
4 | HÔPITAL NOTRE-DAME DU CHUM | 0.98 | |||
5 | HÔPITAL GÉNÉRAL JUIF | 0.90 | 0.19 | ||
6 | GLEN - ENFANTS | 0.86 | 0.38 | ||
7 | PAVILLON L'HÔTEL-DIEU DE QUÉBEC | 0.74 | |||
8 | PAVILLON MAISONNEUVE/PAVILLON MARCEL-LAMOUREUX | 0.66 | 0.20 | 0.09 | |
12 | CENTRE HOSPITALIER UNIVERSITAIRE SAINTE-JUSTINE | 0.72 | 0.20 | ||
13 | INSTITUT DE CARDIOLOGIE DE MONTRÉAL | 0.97 | |||
15 | HÔPITAL FLEURIMONT | 0.53-C | 0.16 | 0.24 | |
15 | HÔPITAL FLEURIMONT | 0.36-M | |||
18 | HÔTEL-DIEU DE LÉVIS | 0.33 | |||
20 | HÔPITAL DE CHICOUTIMI | 0.74 | 1.01 | ||
21 | HÔPITAL SAINT-LUC DU CHUM | 0.85 | |||
22 | HÔTEL-DIEU DU CHUM | 0.57-B | 0.36 | ||
22 | HÔTEL-DIEU DU CHUM | 1.03-X | |||
25 | HÔPITAL DU SACRÉ-COEUR DE MONTRÉAL | 0.54 | |||
27 | PAVILLON CENTRE HOSPITALIER DE L'UNIVERSITÉ LAVAL | 0.19 | 0.47 | 0.16 | |
28 | PAVILLON SAINT-FRANCOIS D'ASSISE | 0.29 | |||
29 | HÔPITAL GÉNÉRAL DE MONTRÉAL | 0.70 | |||
30 | HOTEL-DIEU DE SHERBROOKE | 0.25 | |||
31 | PAVILLON SAINTE-MARIE | 0.54 | |||
33 | INSTITUT UNIVERSITAIRE DE CARDIOLOGIE ET DE PNEUMOLOGIE DE QUÉBEC | 0.90-C | |||
33 | INSTITUT UNIVERSITAIRE DE CARDIOLOGIE ET DE PNEUMOLOGIE DE QUÉBEC | 0.66-X | |||
48 | CENTRE HOSPITALIER DE ST. MARY | 0.45 | |||
118 | HÔPITAL NEUROLOGIQUE DE MONTRÉAL | 0.22 |
|
|
|
2011–2015 percentile ranking | 10th | 0.27 | 0.16 | 0.21 | 0.01 |
| 25th | 0.42 | 0.16 | 0.33 | 0.13 | |
| 50th | 0.58 | 0.27 | 0.52 | 0.21 | |
| 75th | 0.79 | 0.37 | 0.65 | 0.26 | |
| 90th | 0.87 | 0.37 | 0.72 | 0.41 | |
* In healthcare facilities with more than one type of adult ICU: C = surgical, M = medical, X = mixed and B = burn trauma.
Table 9 – Catheter Utilization Ratio per ICU, Breakdown for 2011–2015, by ICU Types, for Non-teaching Healthcare Facilities, Québec, 2015–2016
| Facility | Adult, non-teaching | |
|---|---|---|
9 | HÔPITAL DU HAUT-RICHELIEU | 0.23 |
10 | HÔPITAL PIERRE-BOUCHER | 0.30 |
11 | HÔPITAL PIERRE-LE GARDEUR | 0.57 |
14 | CENTRE HOSPITALIER RÉGIONAL DE LANAUDIÈRE | 0.15 |
16 | HÔPITAL RÉGIONAL DE RIMOUSKI | 0.28 |
19 | HÔPITAL CITÉ DE LA SANTÉ | 0.31 |
23 | HÔTEL-DIEU D'ARTHABASKA | 0.14 |
26 | HÔPITAL DE VERDUN | 0.55 |
32 | CENTRE HOSPITALIER RÉGIONAL DU GRAND-PORTAGE | 0.42 |
34 | HÔPITAL SANTA CABRINI | 0.31 |
35 | HÔPITAL HONORÉ-MERCIER | 0.32 |
36 | HÔPITAL GÉNÉRAL DU LAKESHORE | 0.67 |
37 | HÔTEL-DIEU DE SOREL | 0.21 |
38 | HÔPITAL JEAN-TALON | 0.33 |
40 | HÔPITAL DE HULL | 0.60 |
42 | CENTRE HOSPITALIER ANNA-LABERGE | 0.43 |
44 | HÔPITAL SAINTE-CROIX | 0.07 |
45 | HÔPITAL DE SAINT-EUSTACHE | 0.23 |
46 | HÔPITAL DE GRANBY | 0.22 |
47 | HÔPITAL DE ROUYN-NORANDA | 0.10 |
58 | HÔPITAL DU SUROÎT | 0.45 |
63 | HÔPITAL DE SAINT-GEORGES | 0.14 |
64 | HÔPITAL LE ROYER | 0.21 |
67 | HÔPITAL ET CENTRE DE RÉADAPTATION DE JONQUIÈRE | 0.13 |
80 | HÔPITAL FLEURY | 0.22 |
89 | HÔPITAL DE MONTMAGNY | 0.02 |
101 | HÔPITAL RÉGIONAL DE SAINT-JÉRÔME | 0.30 |
2011–2015 percentile ranking | 10th | 0.11 |
| 25th | 0.16 | |
| 50th | 0.30 | |
| 75th | 0.42 | |
| 90th | 0.61 | |
Author
Comité de surveillance provinciale des infections nosocomiales (SPIN) – bactériémies sur cathéters centraux aux soins intensifs
Editorial Committee
Christophe Garenc, Direction des risques biologiques et de la santé au travail, Institut national de santé publique du Québec
Élise Fortin, Direction des risques biologiques et de la santé au travail, Institut national de santé publique du Québec
Danielle Moisan, Centre hospitalier régional du Grand-Portage
Muleka Ngenda-Muadi, Direction des risques biologiques et de la santé au travail, Institut national de santé publique du Québec
Caroline Quach, Centre universitaire de santé McGill, Hôpital de Montréal pour enfants
Isabelle Rocher, Direction des risques biologiques et de la santé au travail, Institut national de santé publique du Québec
Mélissa Trudeau, Direction des risques biologiques et de la santé au travail, Institut national de santé publique du Québec
Jasmin Villeneuve, Direction des risques biologiques et de la santé au travail, Institut national de santé publique du Québec